
10B: ~2.5 billion paired reads, $1400
1.5B: ~3 billion paired reads, 10B: ~20 billion paired reads, 25B: ~50 billion paired reads
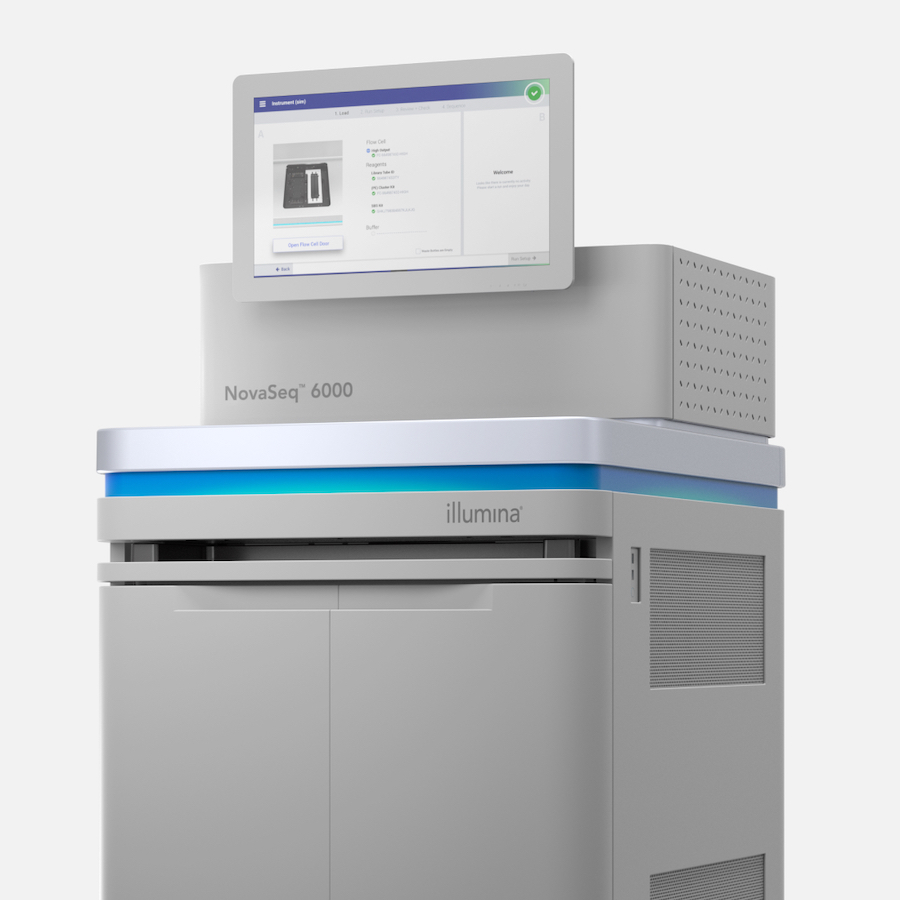
We now offer runs on the new Novaseq X Plus platform. If you require NovaSeq 6000 please contact David Mohr for details
GRCF High Throughput Sequencing Center
Our goal is to provide the Johns Hopkins community access to Next Generation sequencing platforms.
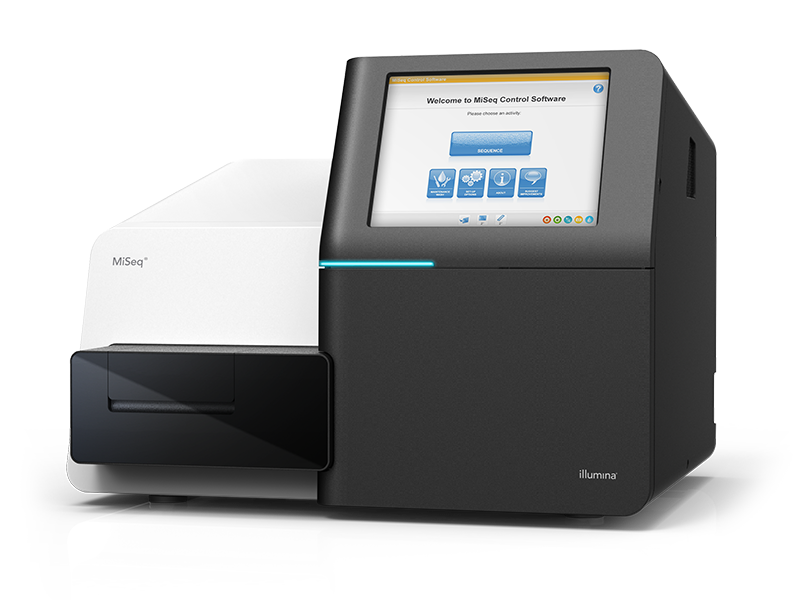
We currently feature MiSeq and NovaSeq X Plus instruments. We do our best to sequence samples in a timely manner, but our primary focus is on generating high quality data.
Pricing Tables
NovaSeq runs include additional cycles for dual indexed libraries.
| 1.5B | 10B | 25B |
|---|---|---|
| 100 cycle: $3,400 | 100 cycle: $8,400 | |
| 200 cycle: $3,700 | 200 cycle: $10,300 | |
| 300 cycle: $4,900 | 300 cycle: $10,900 | 300 cycle: $17,200 |
NovaSeq X Plus Lane Pricing
| 10B: ~2.5 billion reads per lane |
|---|
| 2 x 150bp: $1400 |
| 28x10x10x90: $1100 |
High Throughput Sequencing gives you options…
We offer free consultation. Please contact David Mohr to discuss your project in detail.
We offer simple, per lane and per flow cell pricing, along with end to end service for whole exome/custom targeted projects, RNASeq, and whole genome.
We offer single lane loading on NovaSeq X Plus 10B to accommodate users who do not need the throughput of a full flowcell.
Sample Requirements
NovaSeq Runs
For NovaSeq runs, please submit at least 50ul of your sample at 4nM.
Pooling
Samples should be pooled.
QC Preferences
Nanodrop is not reliable. Intercalating dye methods or qPCR are preferred.
MiSeq Runs
Please submit 10μl of your sample at 2nM for MiSeq.
Quality Control
We will do a QC check via Bioanalyzer to increase the likelihood of quality data, but you should quantitate your sample as accurately as possible prior to submission.
Questions
Please contact us with any sample preparation questions.
Understanding Data Yield
Our facility features the NovaSeq platform. Yield is dependent upon several factors:
Read Length & Read Type
The longer the read, the more data. Paired end reads yield twice the data as single read.
Uniform Base Composition
Libraries that have uneven base composition tend to pose problems with the analysis software. These issues can be mitigated using several strategies, but the net effect will be lower data yield than a balanced library.
Optimal Cluster Density
It is imperative to accurately quantitate your library to ensure high data yield. We do our best to QC libraries before sequencing, but we cannot pool samples for you.
High Quality Library
Libraries that contain a high level of adapter dimers will yield significantly less data, particularly on the NovaSeq6000. Similarly, over amplified libraries can negatively impact yield
Please see Illumina’s NovaSeq6000 Specification page for current data yields. While we regularly achieve greater than ‘spec’ yields from the NovaSeq6000, it is best to be conservative when planning your experiments.
Data Delivery
Per lane/flowcell sequencing
Data will be returned in Sanger FASTQ format via our high speed aspera server.
End to end services
Alignment files, variant calls, and any intermediate files you wish via aspera server.